Analytics (NEW)
Merlin's granular P&L reporting is now out

Datai
Last Update 3 years ago
Merlin's new Analytics page has many features that are useful for analysing your positions, overall performance over time and P&L by protocol. Let's dive in.
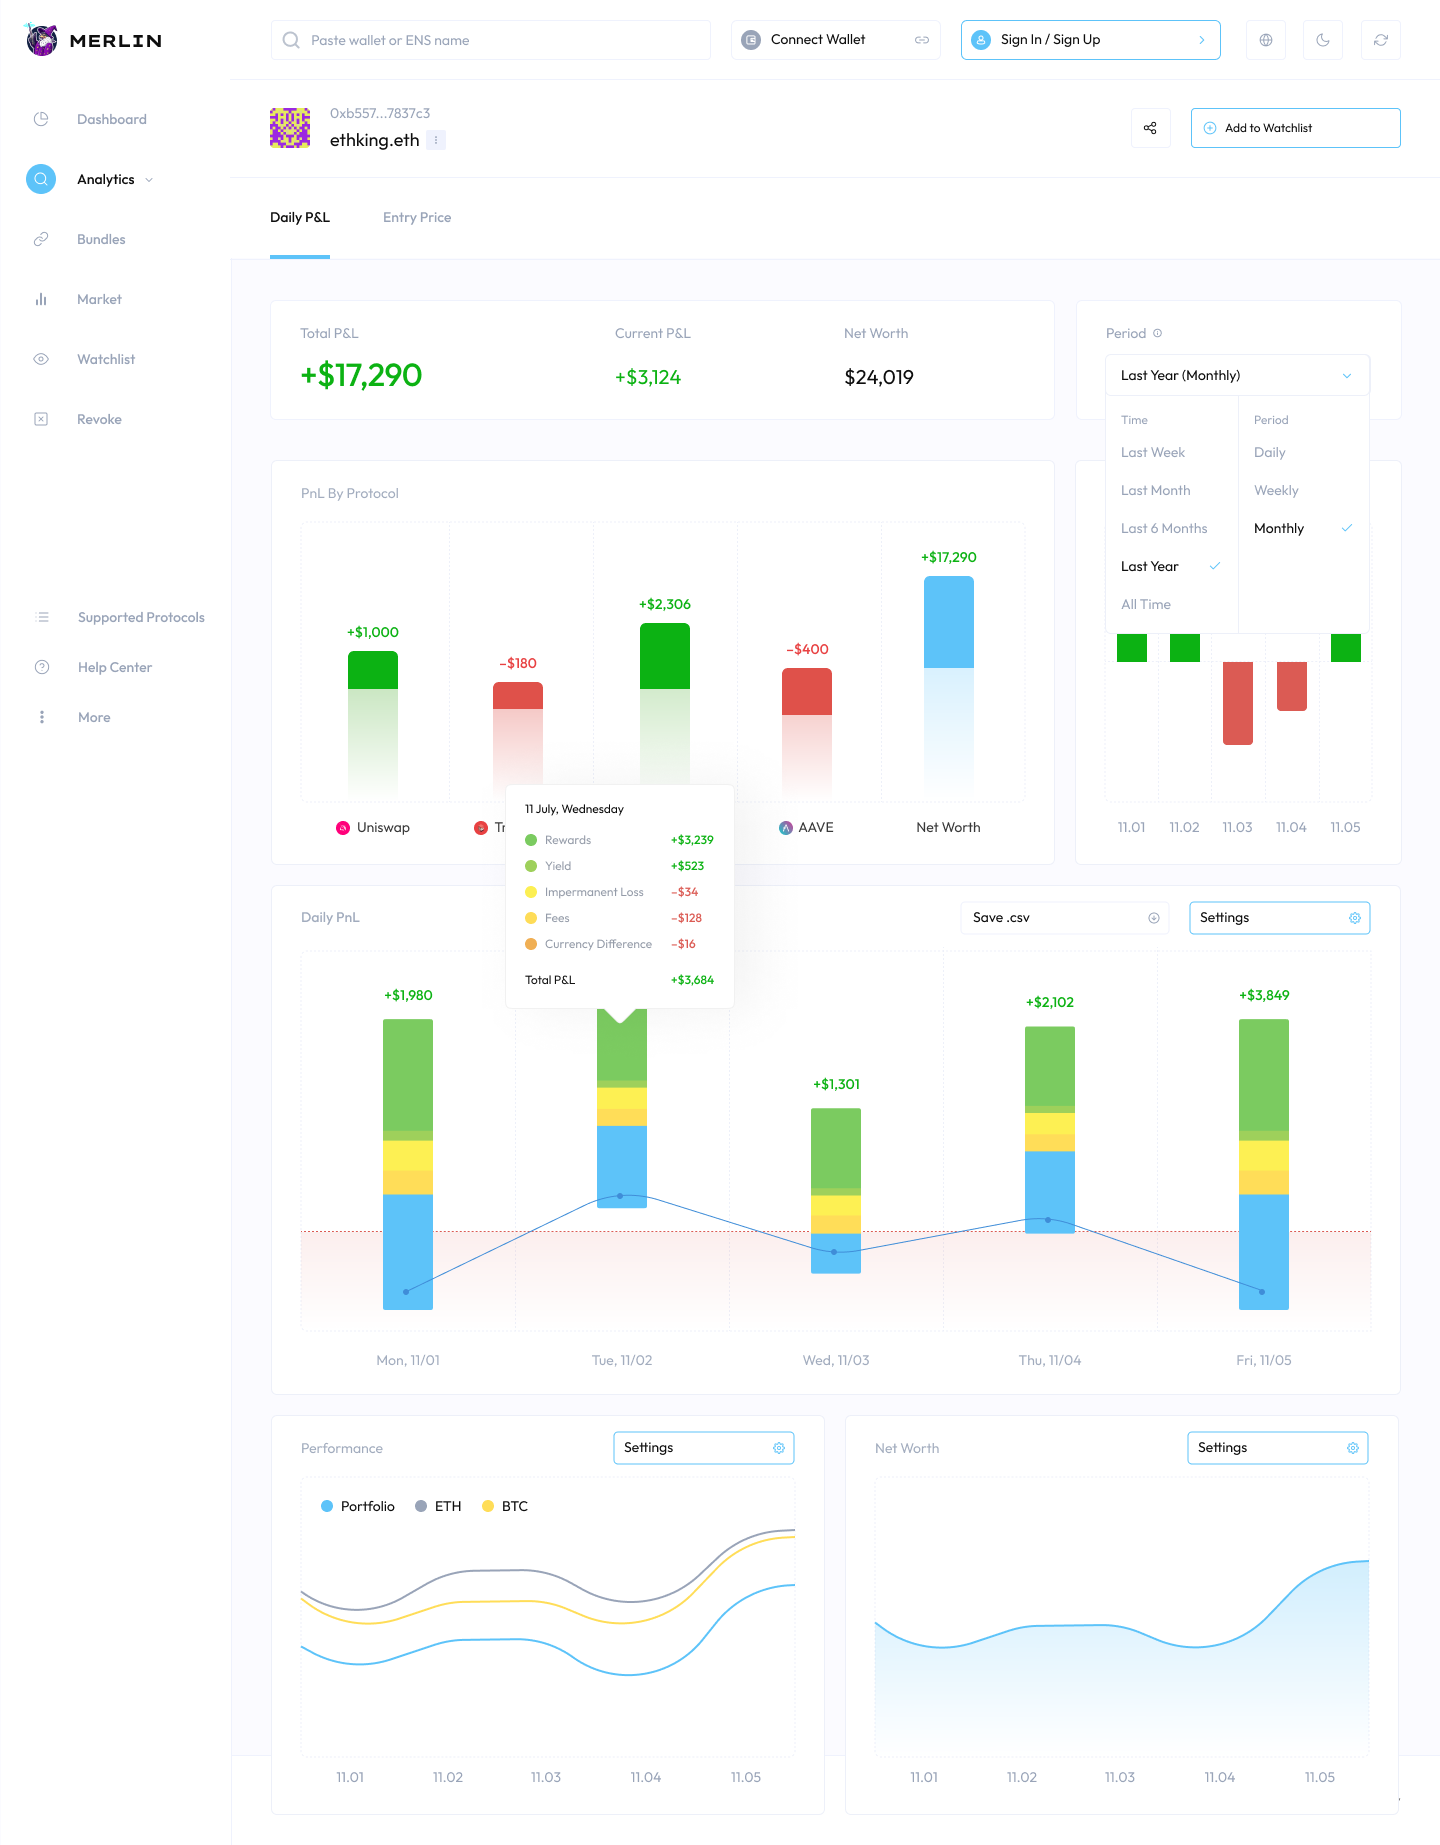
As can be seen by the above charts, Merlin showcases total and current P&L, P&L by protocol and an option to view the portfolio's performance over selected timeframes (both as a period and frequency).
For example, the daily P&L chart above depicts the performance of the portfolio over a 5 day period, including metrics such as rewards, yield, impermanent loss, fees and currency difference.
The other charts show the portfolio performance compared to ETH and BTC, and net worth over time